


Even the smallest instance of fraud can devastate an organization’s bank accounts, not to mention its reputation. When performing a forensic accounting engagement, data analytics are an effective tool for identifying red flags and trends within a business that merit additional examination. On their own, data analytics are typically not proof of fraud, but they do allow us to focus our efforts more efficiently, and when combined with other evidence, can help connect the dots.
Here are some common ways we use data analytics in a forensic accounting engagement.
HORIZONTAL AND VERTICAL ANALYSIS
Horizontal analysis examines changes line by line between specific accounting periods, usually quarterly or yearly, and is used to compare line items over specific periods of time in order to spot trends and anomalies. In order to spot anomalies or determine if a trend is reasonable, we first need to discuss with management what happened and what should have happened over the past several periods to determine accurate expectations.

Vertical analysis calculates balance sheet or income statement amounts as a percentage of total assets (balance sheet) or net sales (income statement) and is used to compare changes in percentages from period to period. Vertical analysis is frequently used to compare company performance with others in the same industry as a benchmark. This analysis can often identify anomalies that horizontal analysis does not, especially if fraud has been ongoing for a significant period of time.
DATE AND TIME ANALYSIS
Most accounting systems track the date and time that entries are made and we use that to our advantage by identifying any transactions that occurred at an odd time of day or day of the week. If the client is a 9-to-5 business, we wouldn’t normally expect transactions to be recorded at midnight or on a holiday.
CUSTOMER AND VENDOR ANALYSIS
If there is suspicion of fraud through customers or vendors, we would review the client’s approved customer and vendors list to check for duplicate, unrecognized, misspelled, and inactive accounts. Regarding the latter, seeing a customer or vendor the client hasn’t worked with for five years or that is known to be out of business show up on the active customer or vendor list is a red flag and will require follow up. Comparing employee and vendor information is also a good idea, too, as sometimes employees will enter their bank account information when creating a fraudulent vendor account.
BENFORD’S LAW ANALYSIS
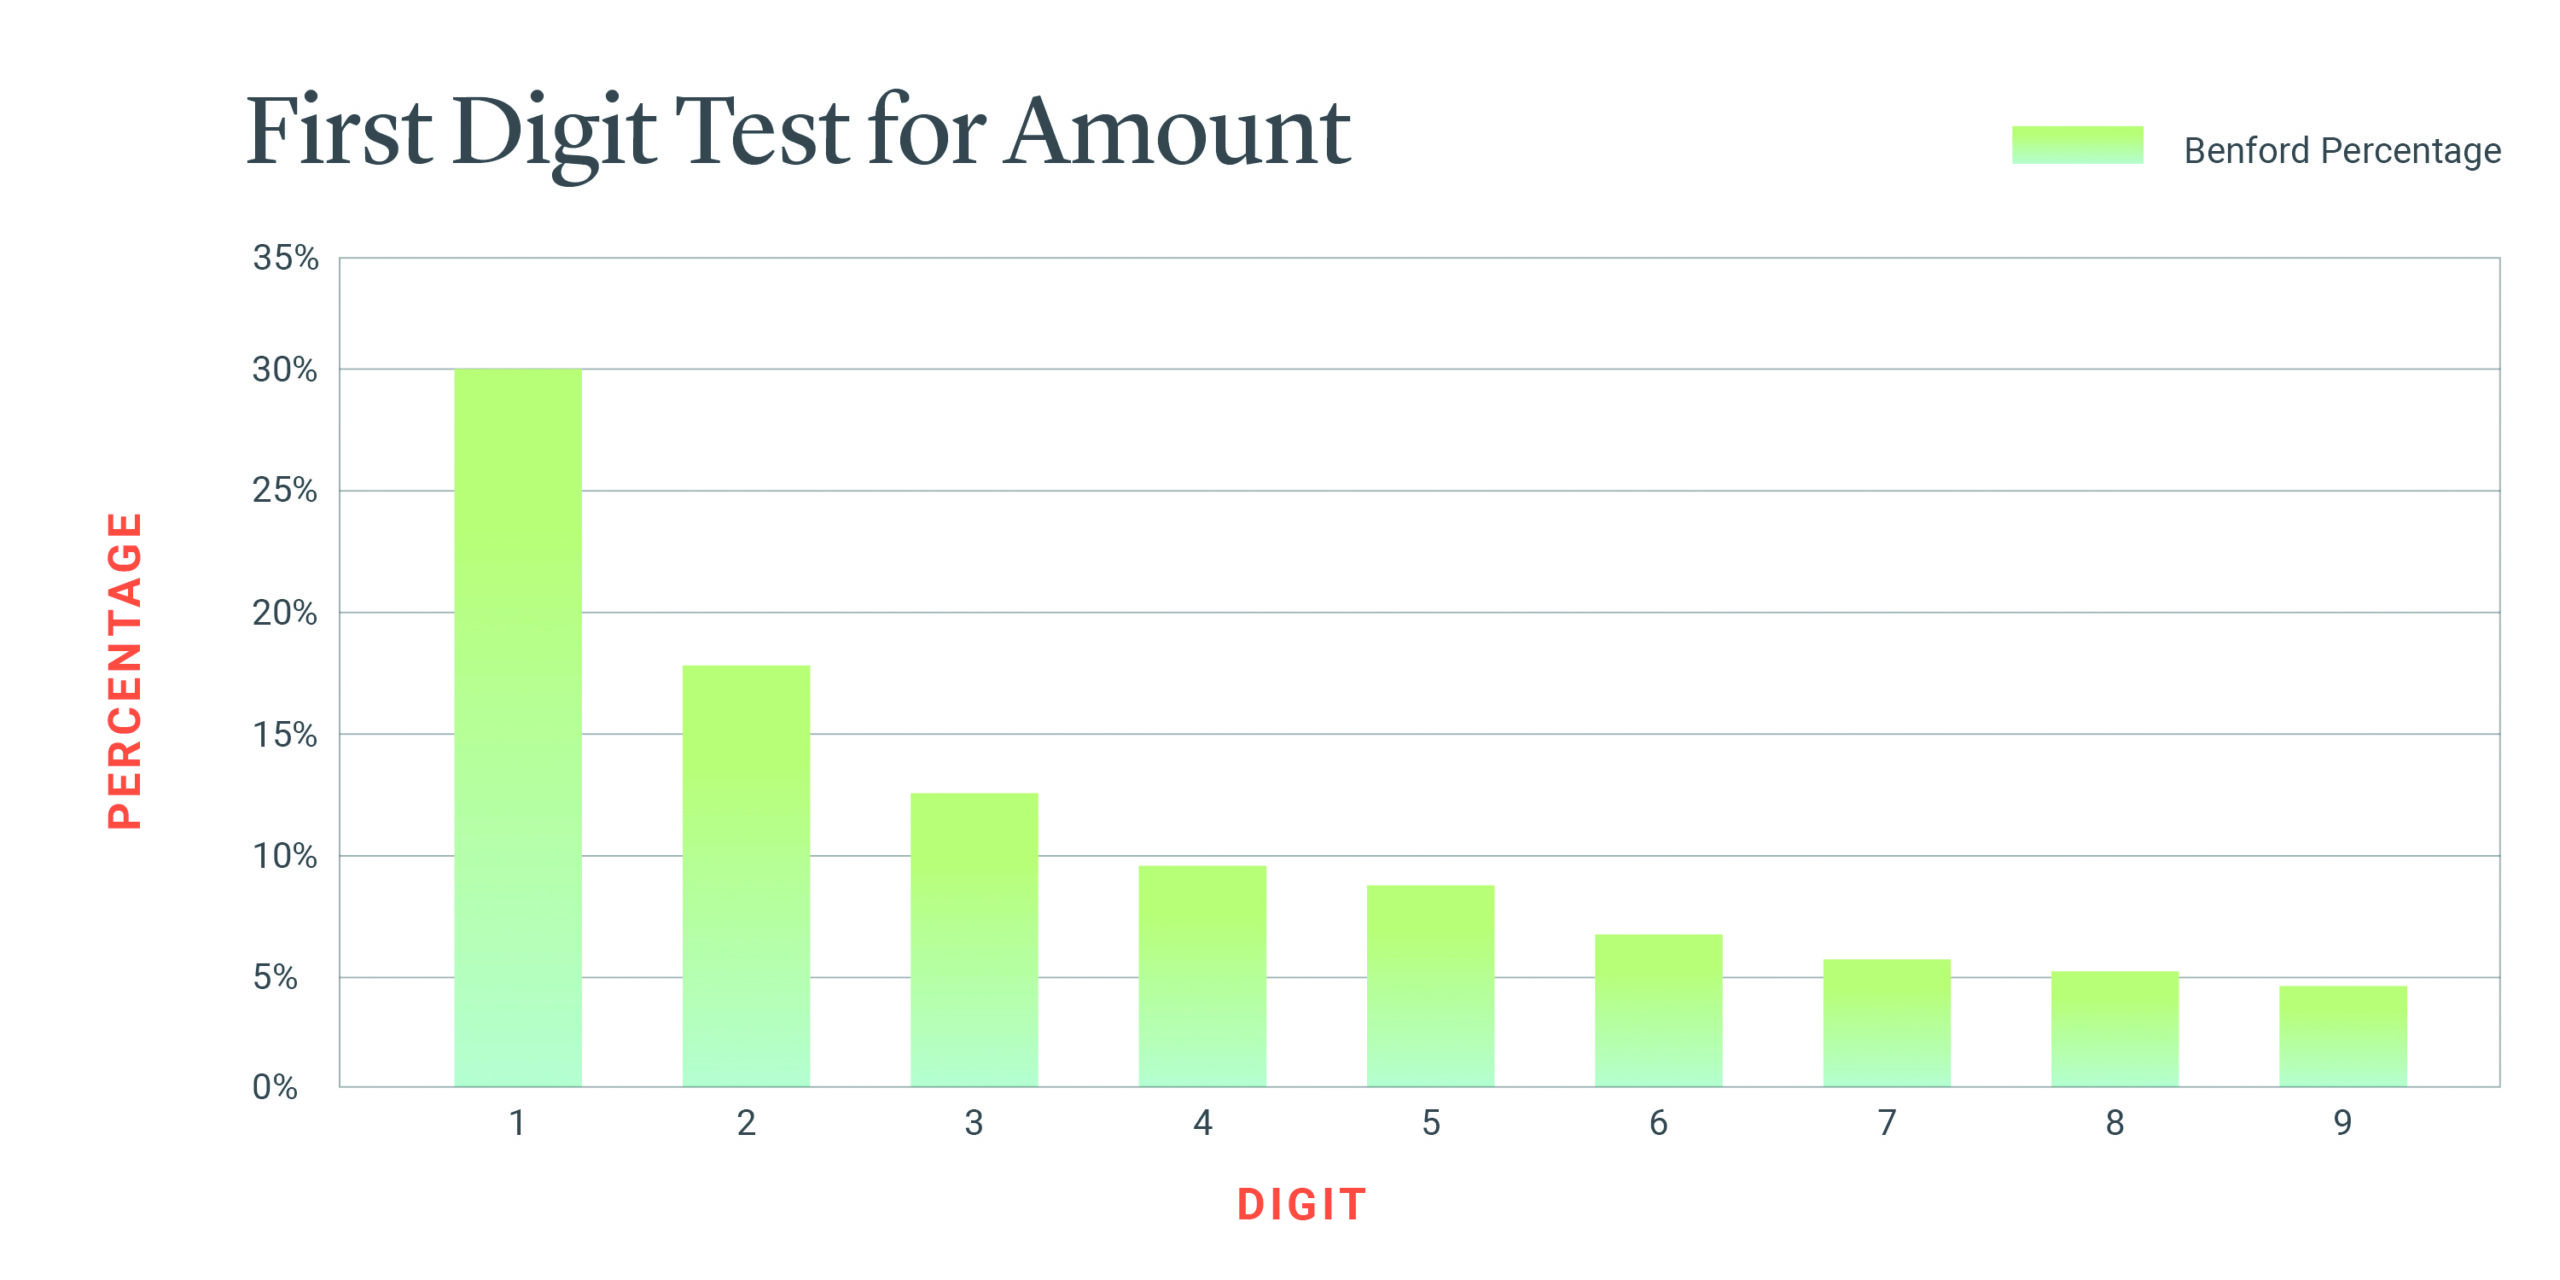

Benford’s Law says that there is a relationship within a population of naturally occurring numbers (e.g., check amounts) with how often each digit 1-9 appears as the leading digit. Specifically, Benford’s Law says that 30% of a population’s leading digits will be a one and that percentage decreases through nine, which should appear less than 5% of the time. Using Benford’s Law analysis, it’s possible to identify digits that don’t “fit” within the percentages given by Benford’s Law, which allows us to test transactions from within that subset of the population.
FOLLOW UP
Once the data analytics have been performed, there will undoubtedly be items that require additional follow up: questions to management, detail support to view, or items to add to a discovery request. If you have any questions or if you’d like to learn how our team could help you and your clients’ mitigate risk, feel free to reach out to me.